


The #1 Chart that I'm Watching
The Canary in the Coal Mine

As inflation was raging, treasury bonds were crashing to increase their interest rates. But this bear market in treasuries created an opportunity to sell long term treasuries short and with the proceeds buy high yield (“junk”) bonds. This setup could generate up to 15% in interest income with less than 5% in interest expense. Making this trade on a margin could generate between10% to 50% depending on the junk bond.
And as a bonus, when other people join the trade, treasuries depreciate even more as you can see in the TLT (20 Year Treasuries ETF) chart below.
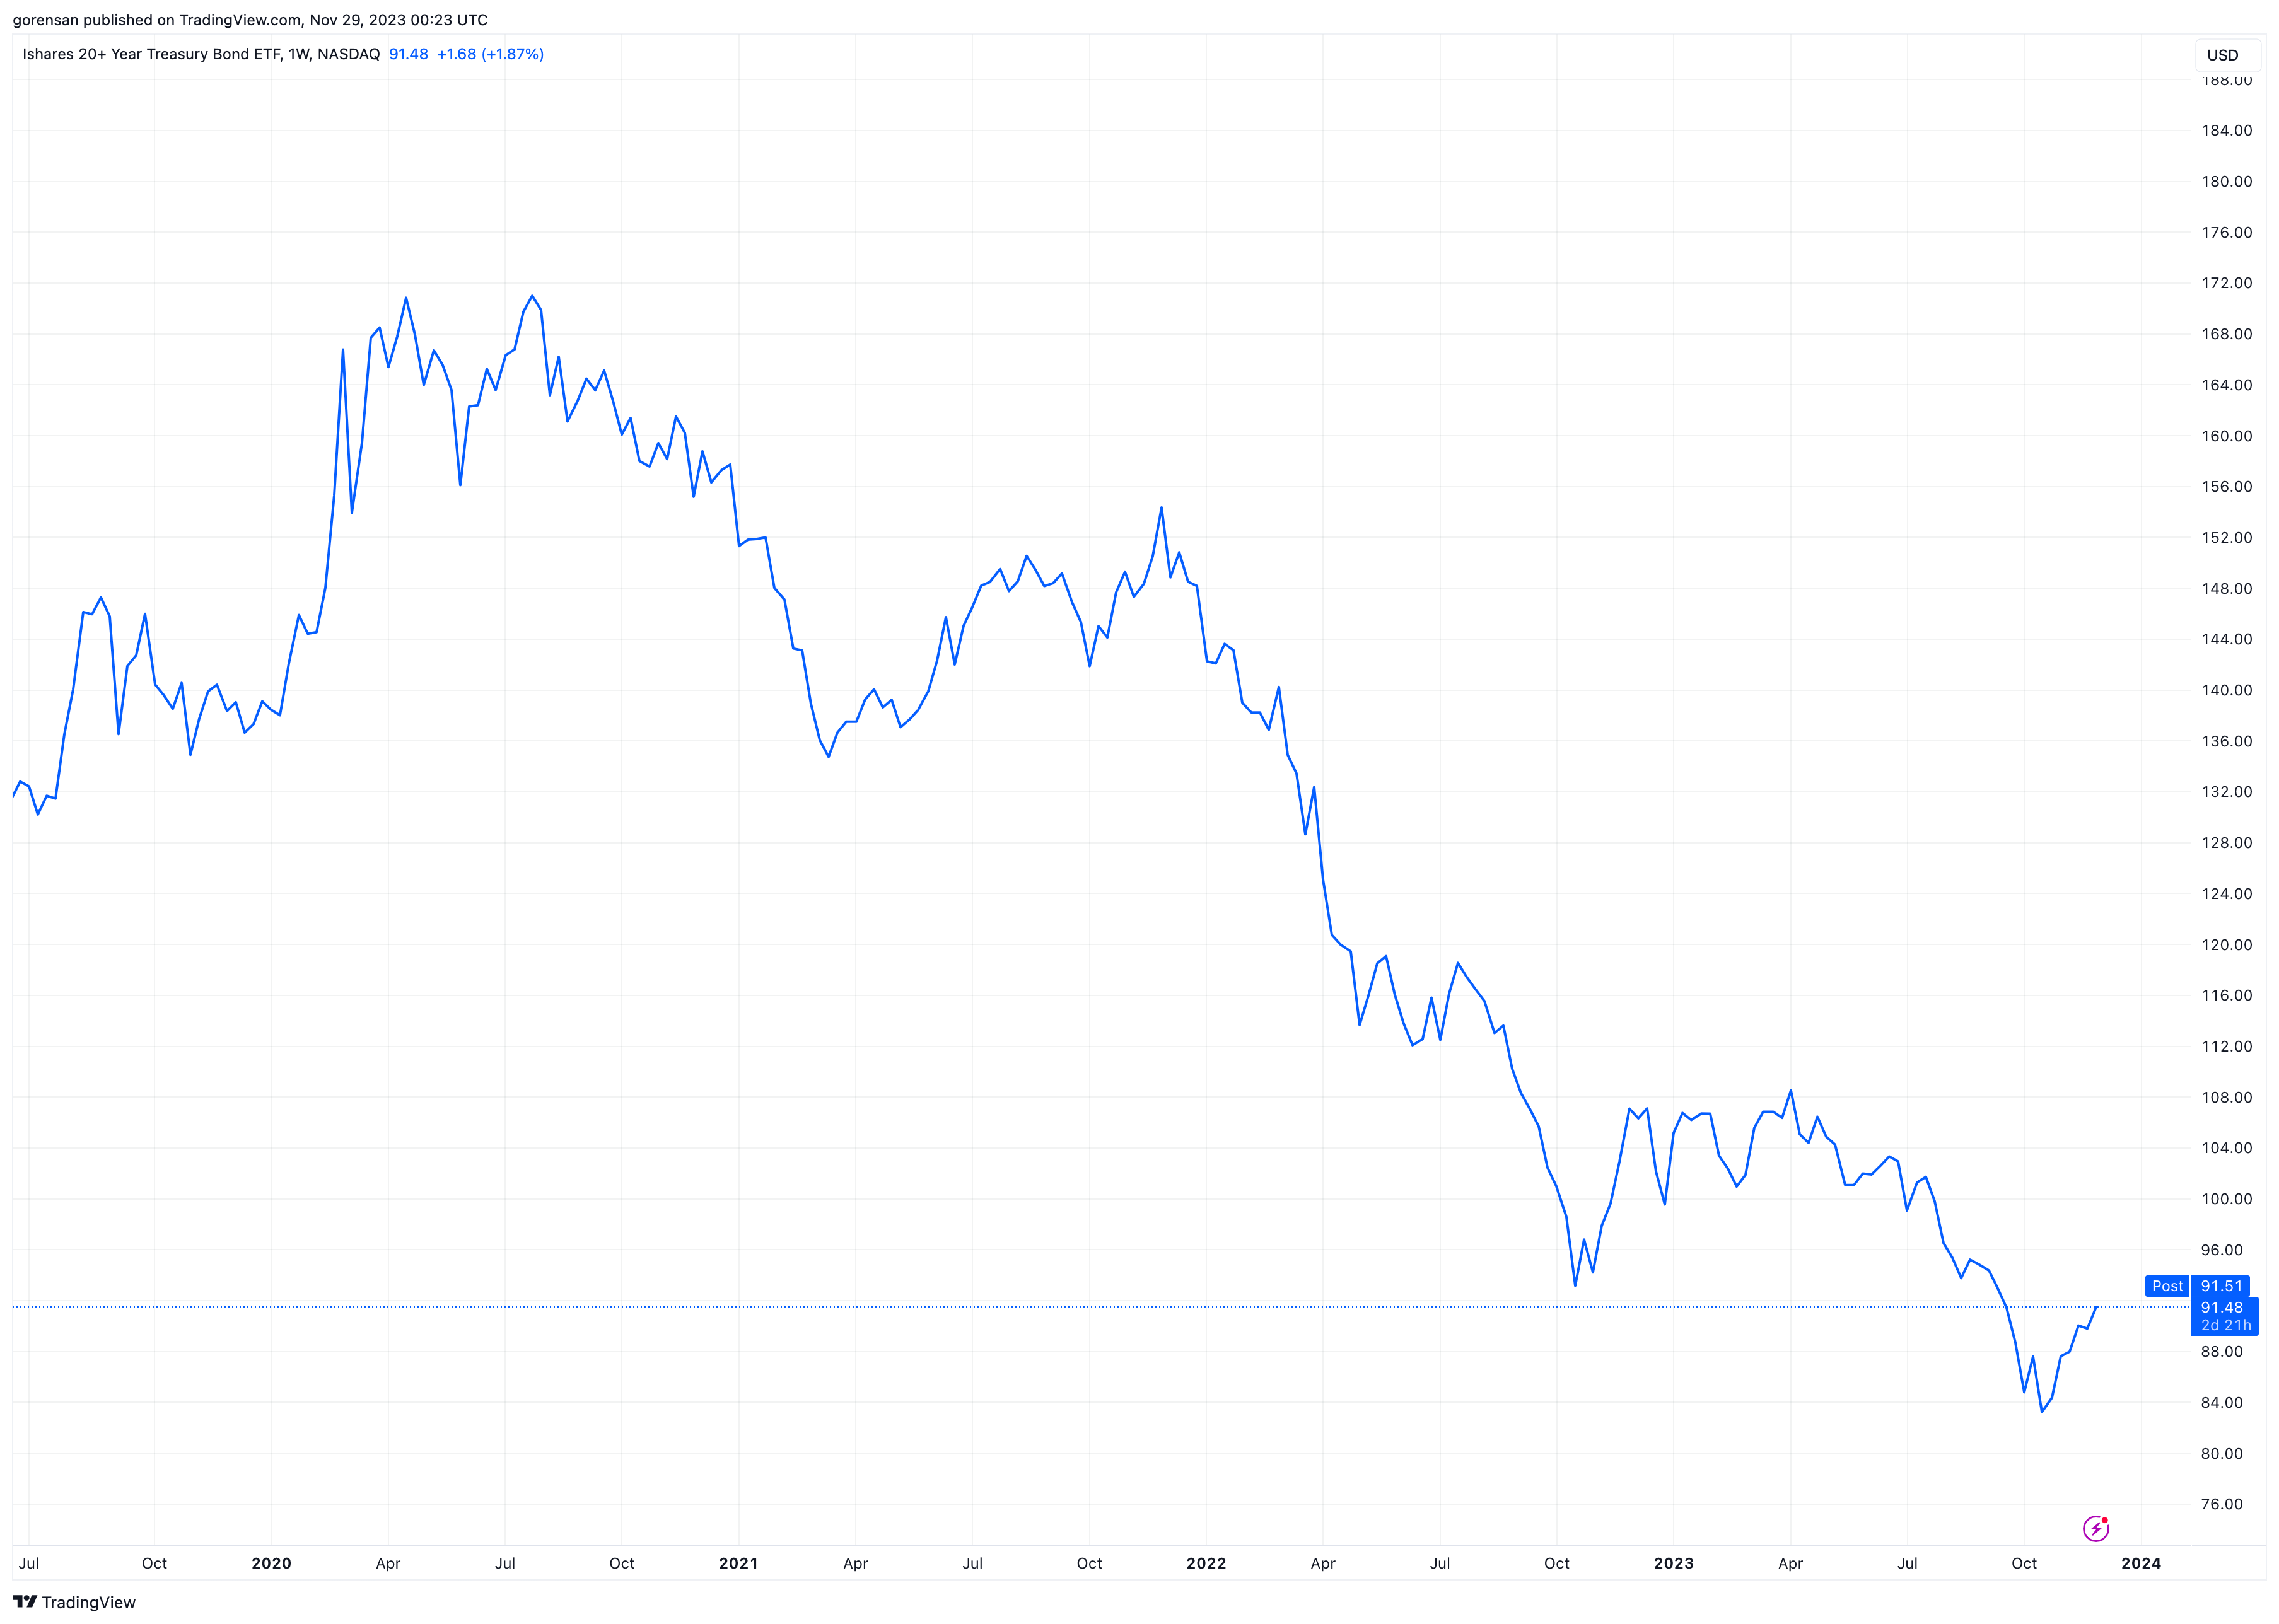
Since 2020, it has been on a downtrend. So buying HYG (High Yield Bonds ETF) while selling TLT has been a great bargain as you can see in the chart below.

But now that inflation has been reduced, this long/short pair is pulling back due to a slight recovery in treasuries (TLT).
The big question on my mind is whether this is just a short term pull back or a reversal of the trend. A reversal is likely to occur in a recession.
The October bear market rally in treasuries generated a sharp rally in the stock indices such as the S&P 500. This rally is based on the soft landing narrative of lower inflation, leading to lower interest rates and no recession.
But a reduction of inflation could also be an early sign of lower demand due to a recession. And according to S&P, junk bonds’ default rates have been increasing, which is another sign of financial stress.
On the other hand, financial conditions are as loose as they were before the Fed began its monetary tightening as you can see in the chart below (up is tight and down is loose).
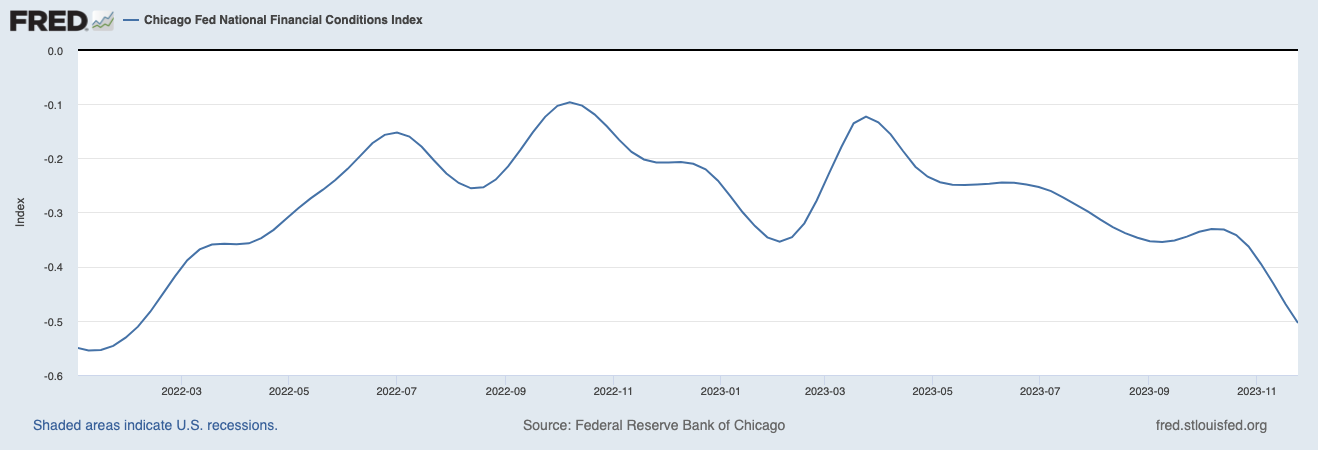
It seems that in the liquidity tug of war between the Fed and the treasury, the latter is “winning”. An election year after all…
The HYG/TLT chart above would tell us where we are headed. If it resumes its trend, it means that inflation is coming back, and interest is staying higher for longer. If it remains at its current level, it is a sign of a soft landing. And if it reverses downward, it means that we are entering a recession and money is flowing from stocks and high yield bonds to treasuries.
You can track this chart here: https://www.tradingview.com/x/OJ3GNuGc/